This document is for informational purposes only. It does not constitute legal advice. Information herein was obtained from government, industry, and other public sources. It has not been independently verified by UPS and is subject to change. Recipient has sole responsibility for determining the usability of any information provided herein. Before recipient acts on the information, recipient should seek professional advice regarding its applicability to the recipient's specific circumstances.
Global Macroeconomic Trends
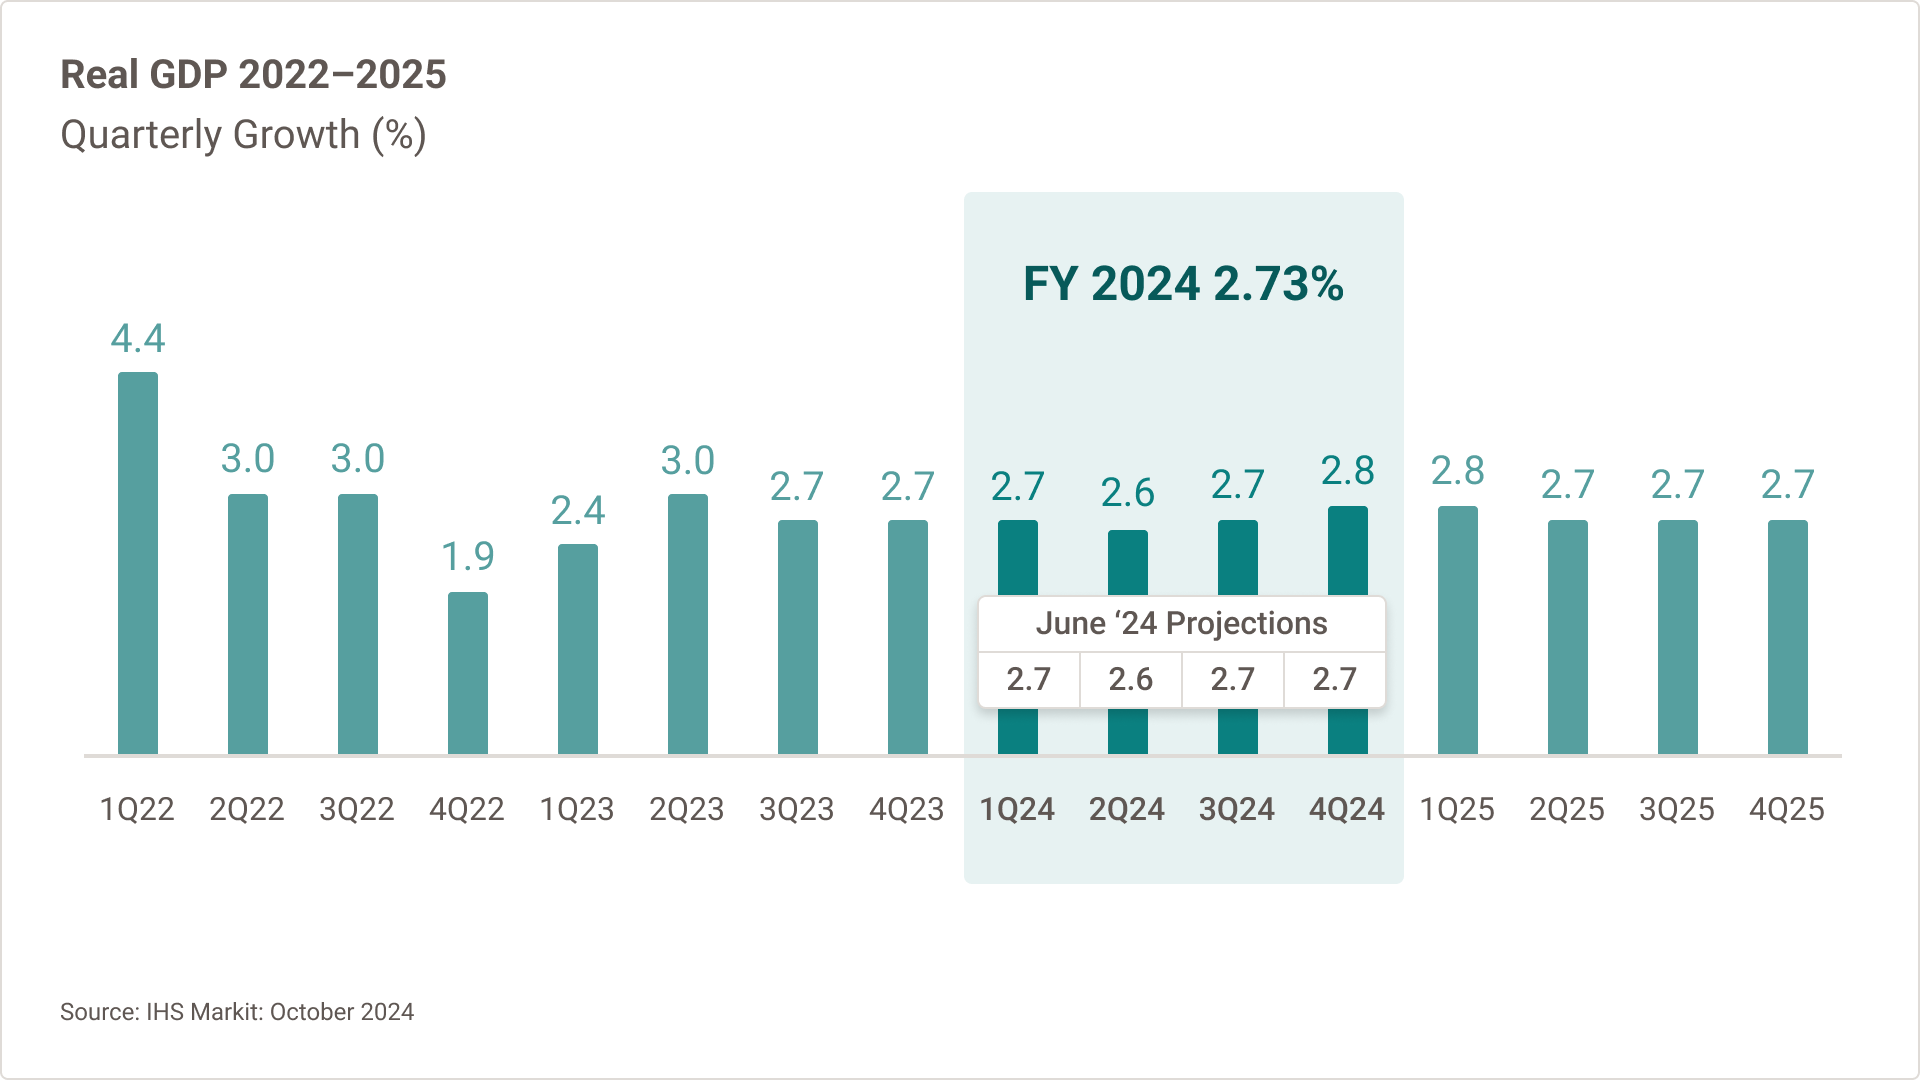
Global GDP growth projections have been revised up from June, led by US growth with China and APAC forecasts decreasing slightly
Real GDP Quarterly Growth
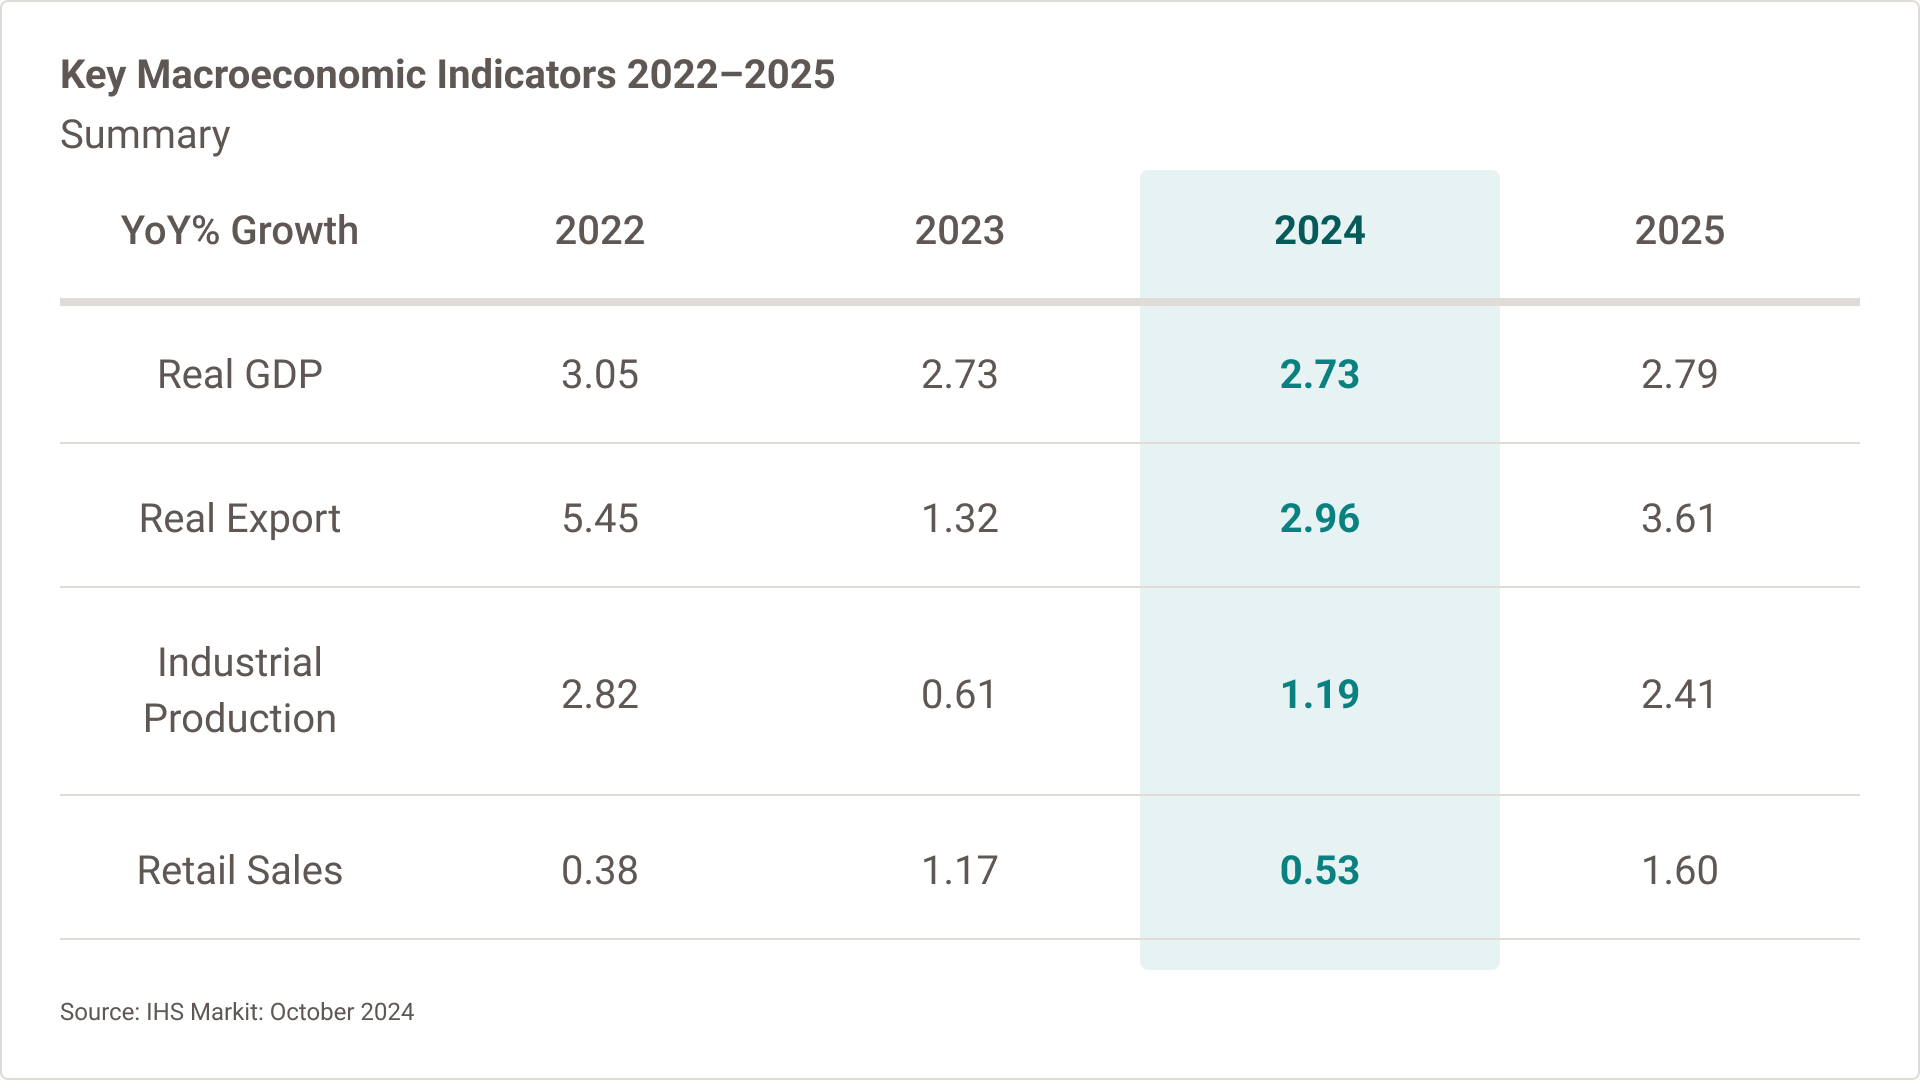
- Real Exports have been revised slightly down from the previous June forecast to 2.96% globally in October, with the decrease from China and the APAC region.
- Industrial Production (October) declined with the Europe and APAC decrease and the slight growth from China and the US, necessitating the revision from the previous June forecast.
- Retail Sales forecasts decreased with the US, China, and APAC declines from previous projections.
Source: IHS-Markit: October 2024
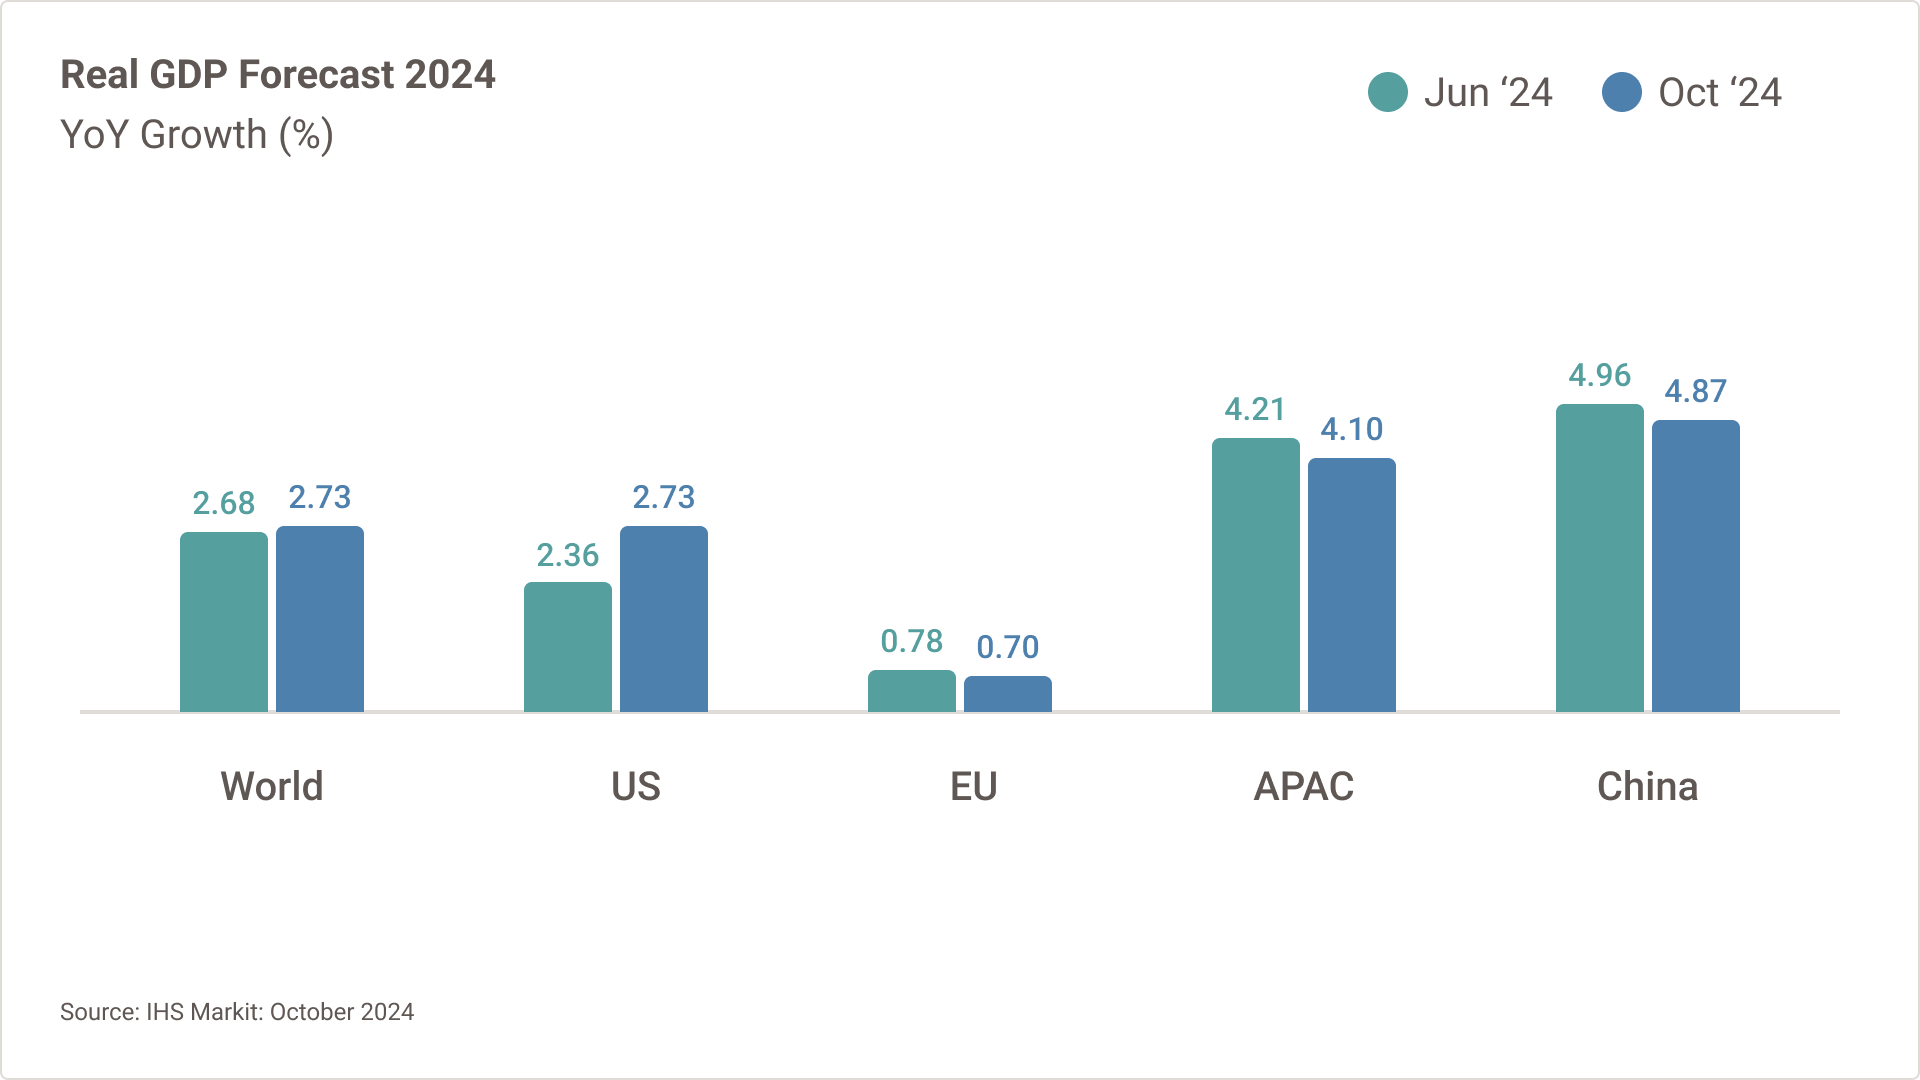
2024 Real GDP Forecast
- World GDP growth forecasts for 2024 have been revised up from 2.68% in June to 2.73% in October.
Purchasing Managers' Index (PMI)
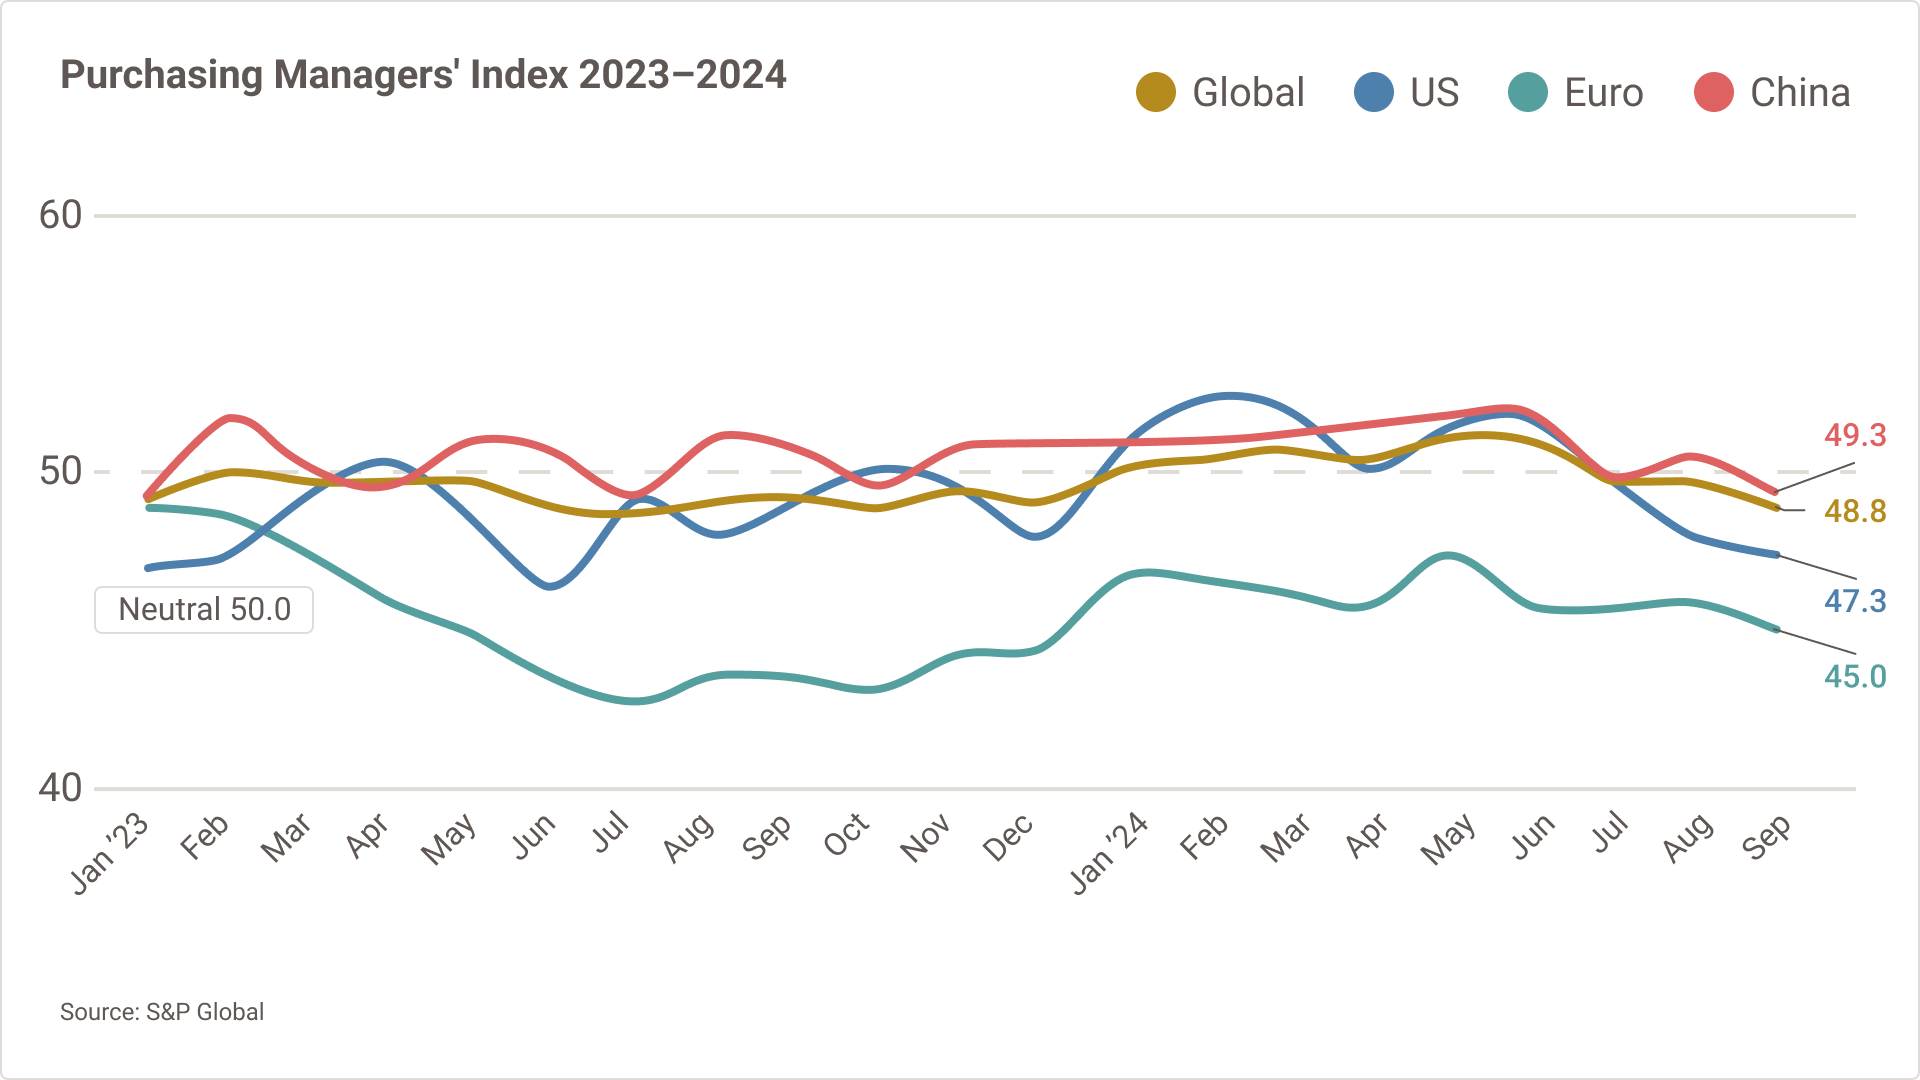
- Global manufacturing PMI decreased to 48.8 in September, due to weaker performance from the US and China.
- China’s manufacturing PMI declined to 49.3 in September, falling below the neutral mark, and new orders declined to the lowest point since September 2022.
- US manufacturing PMI fell to 47.3, the lowest output so far in 2024.
- Eurozone PMI relatively steady at 45.0 due to contraction in new orders and output..
Source: S&P Global
Inflation Rate
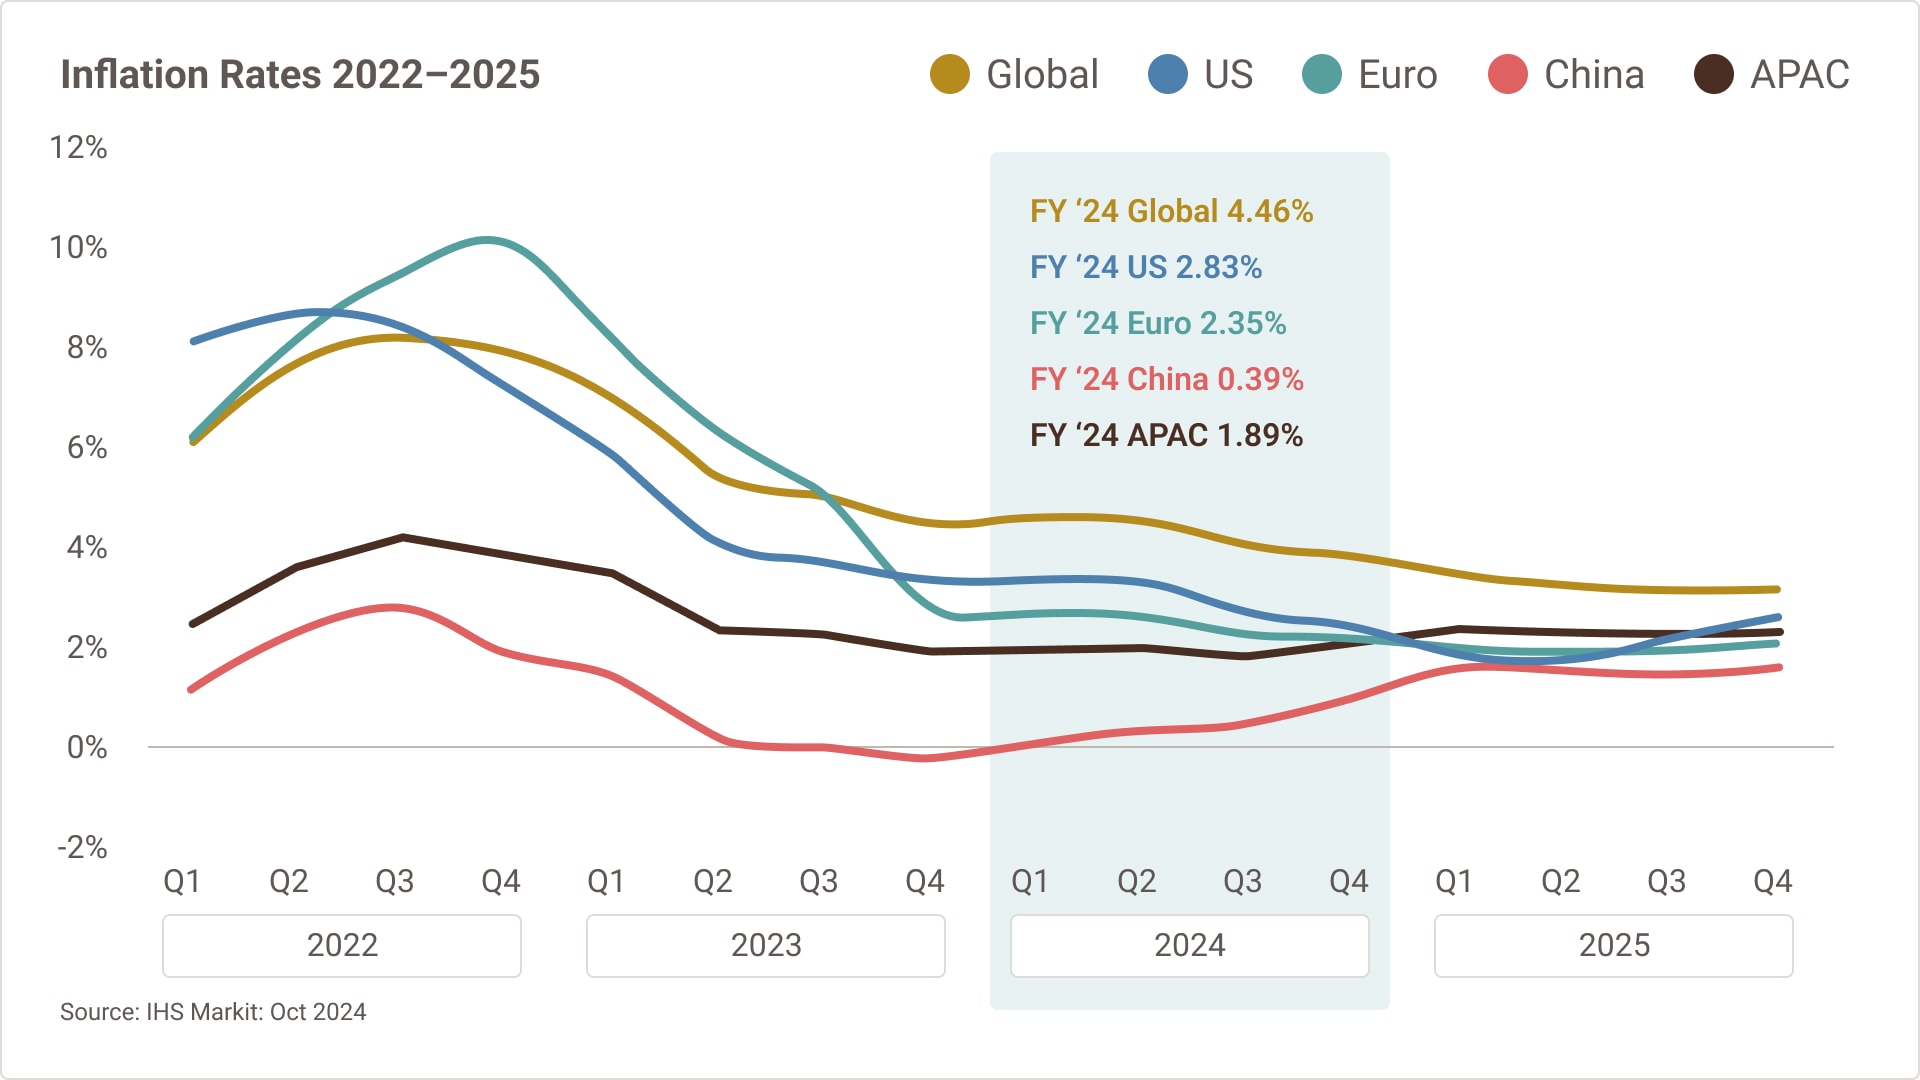
- The global annual inflation rate has been revised slightly down from June (4.63%) to October at 4.46% with slightly lower inflation for 2H 2024.
- Inflation rates in China saw a slight revision up from June (0.2%) to September (0.4%) for 2024, with higher inflation impacting the economy in Q3 and Q4, and are significantly below global inflation rates.
- US inflation rate forecasts are down from June to 2.83% in October, with inflation falling below 3% in each of the final two quarters of 2024.
Source: IHS Markit (Oct ’24 )
Air Freight Market Update
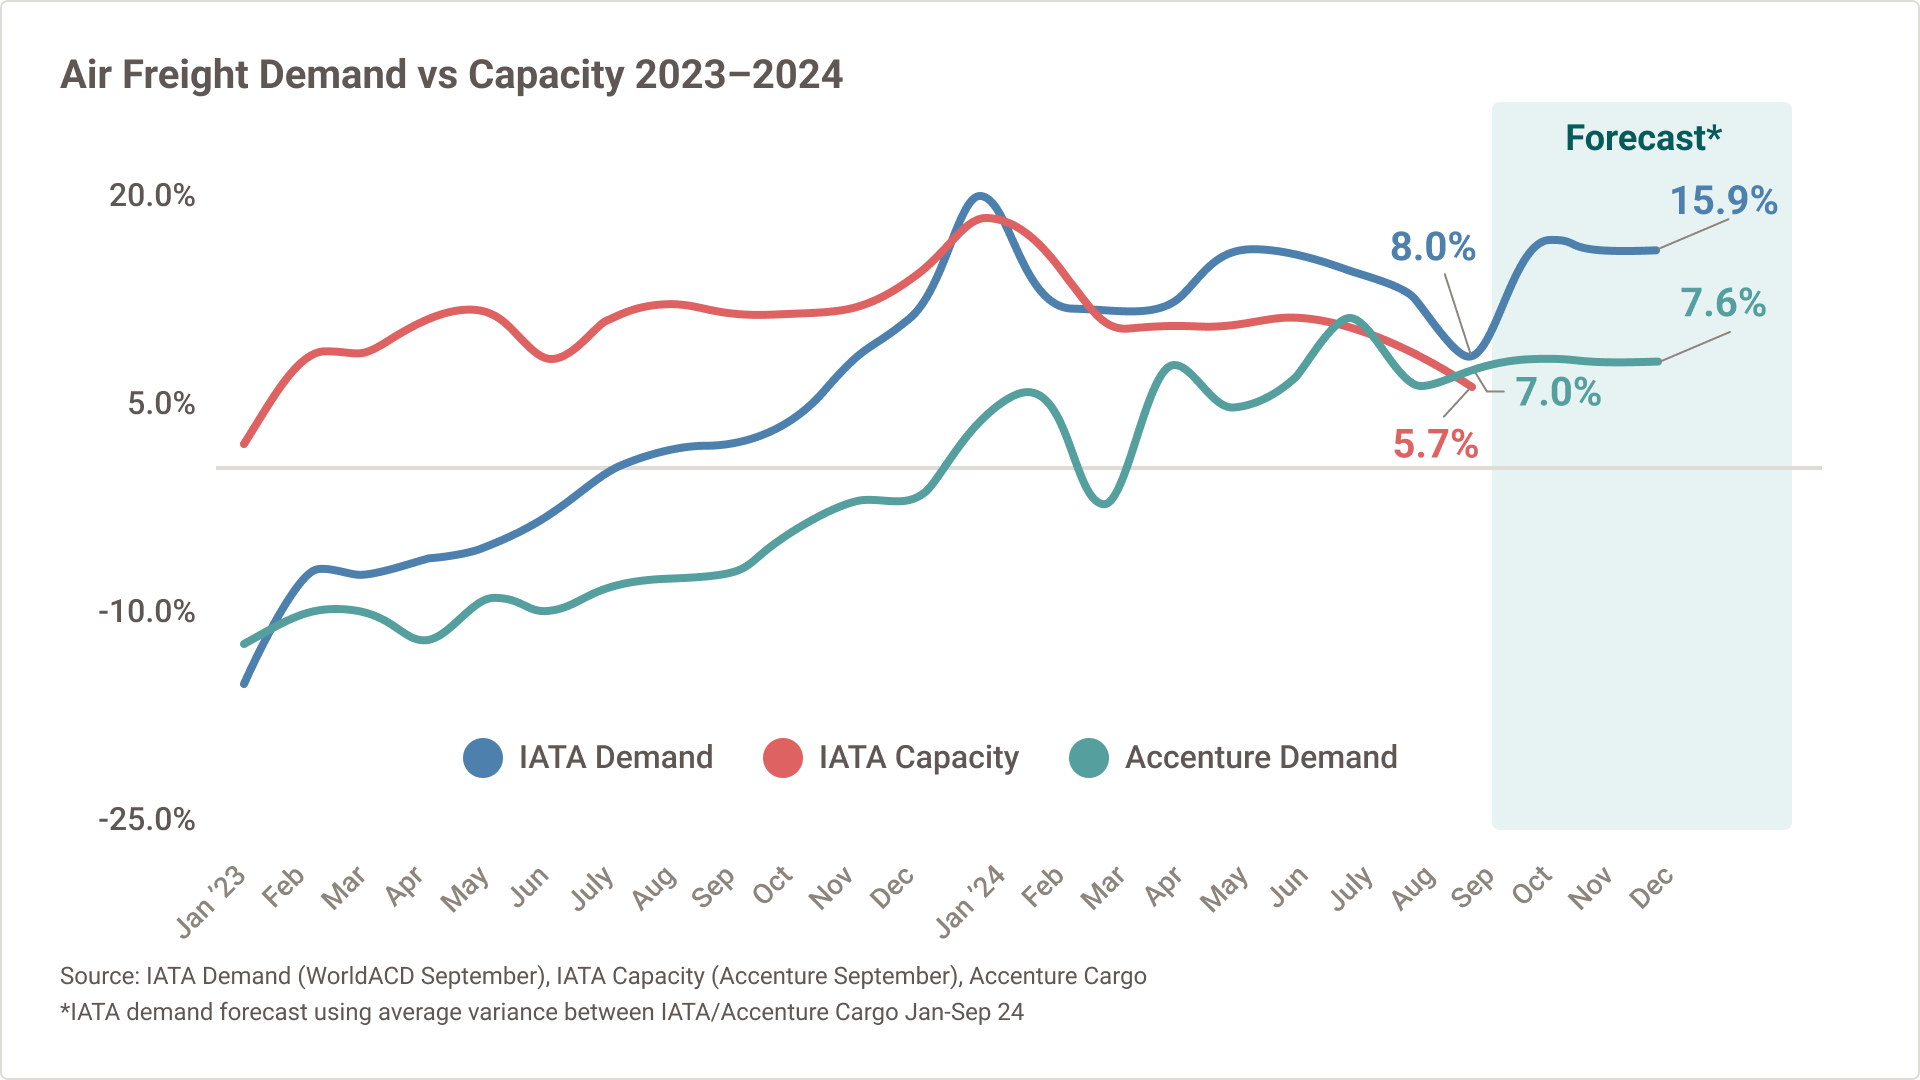
2024 demand continues to outpace capacity growth, leading to increasing market rates, particularly driven by ex-APAC lanes impacted by heavy eCommerce volume.
Demand Vs. Capacity
- Global air cargo demand’s increase of +8.0% in September (+7.0% without eCommerce), marks the first month below double-digit growth for 2024.
- Year-to-date (YTD) international air cargo demand is +13%, with capacity up +11% over the same period (Accenture Cargo).
- Accenture forecast Q4 demand increased to +7.6%, which does not fully account for de minimis eCommerce shipments.
Sources: IATA Demand (WorldACD September), IATA Capacity (Accenture September), Accenture Cargo
*IATA demand forecast using average variance between IATA/Accenture Cargo Jan-Sep 24
Rates
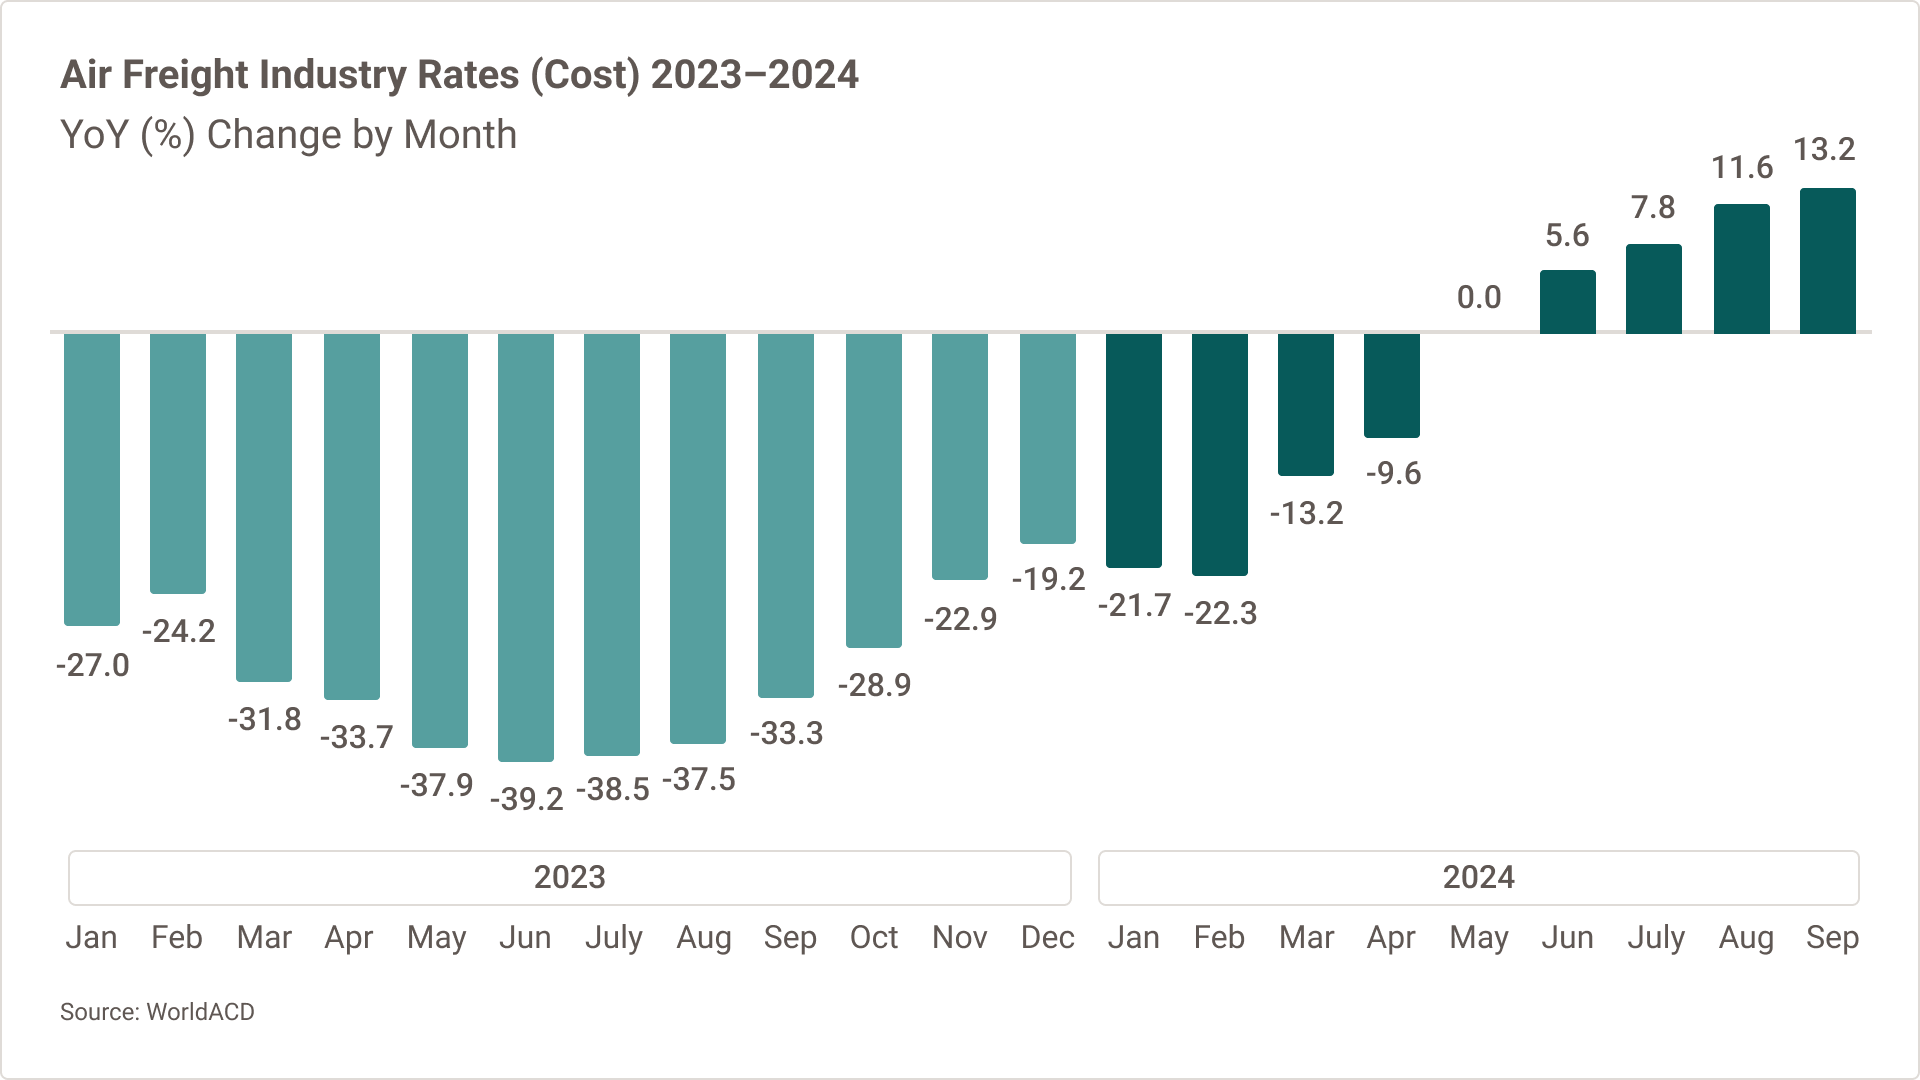
- Market rate is elevated at +13.2% YoY in September as APAC outbound demand continues to grow, driving prices up for APAC → US/EU destinations. YTD Ex-APAC rates remain elevated compared to global market rates, up at +21% Year-over-Year (YoY) growth.
- The Middle East & South Asia region growing rapidly, YTD rates up +58% YoY.
- Demand expected to outpace capacity through Q4 2024, which will likely continue increasing rates, particularly on heavily trafficked lanes.
Source: WorldACD
Air Freight Industry Trends
The eCommerce demand boom continues to power the air freight market with the expectation for a busy 4th quarter to end 2024 as demand continues to outpace available capacity.
Ocean Freight Industry Outlook
Declining demand and repositioning of effective capacity has reduced rates since August, but “wildcards” including potential additional ILA Labor disruption could reverse rate trends in 4Q24.
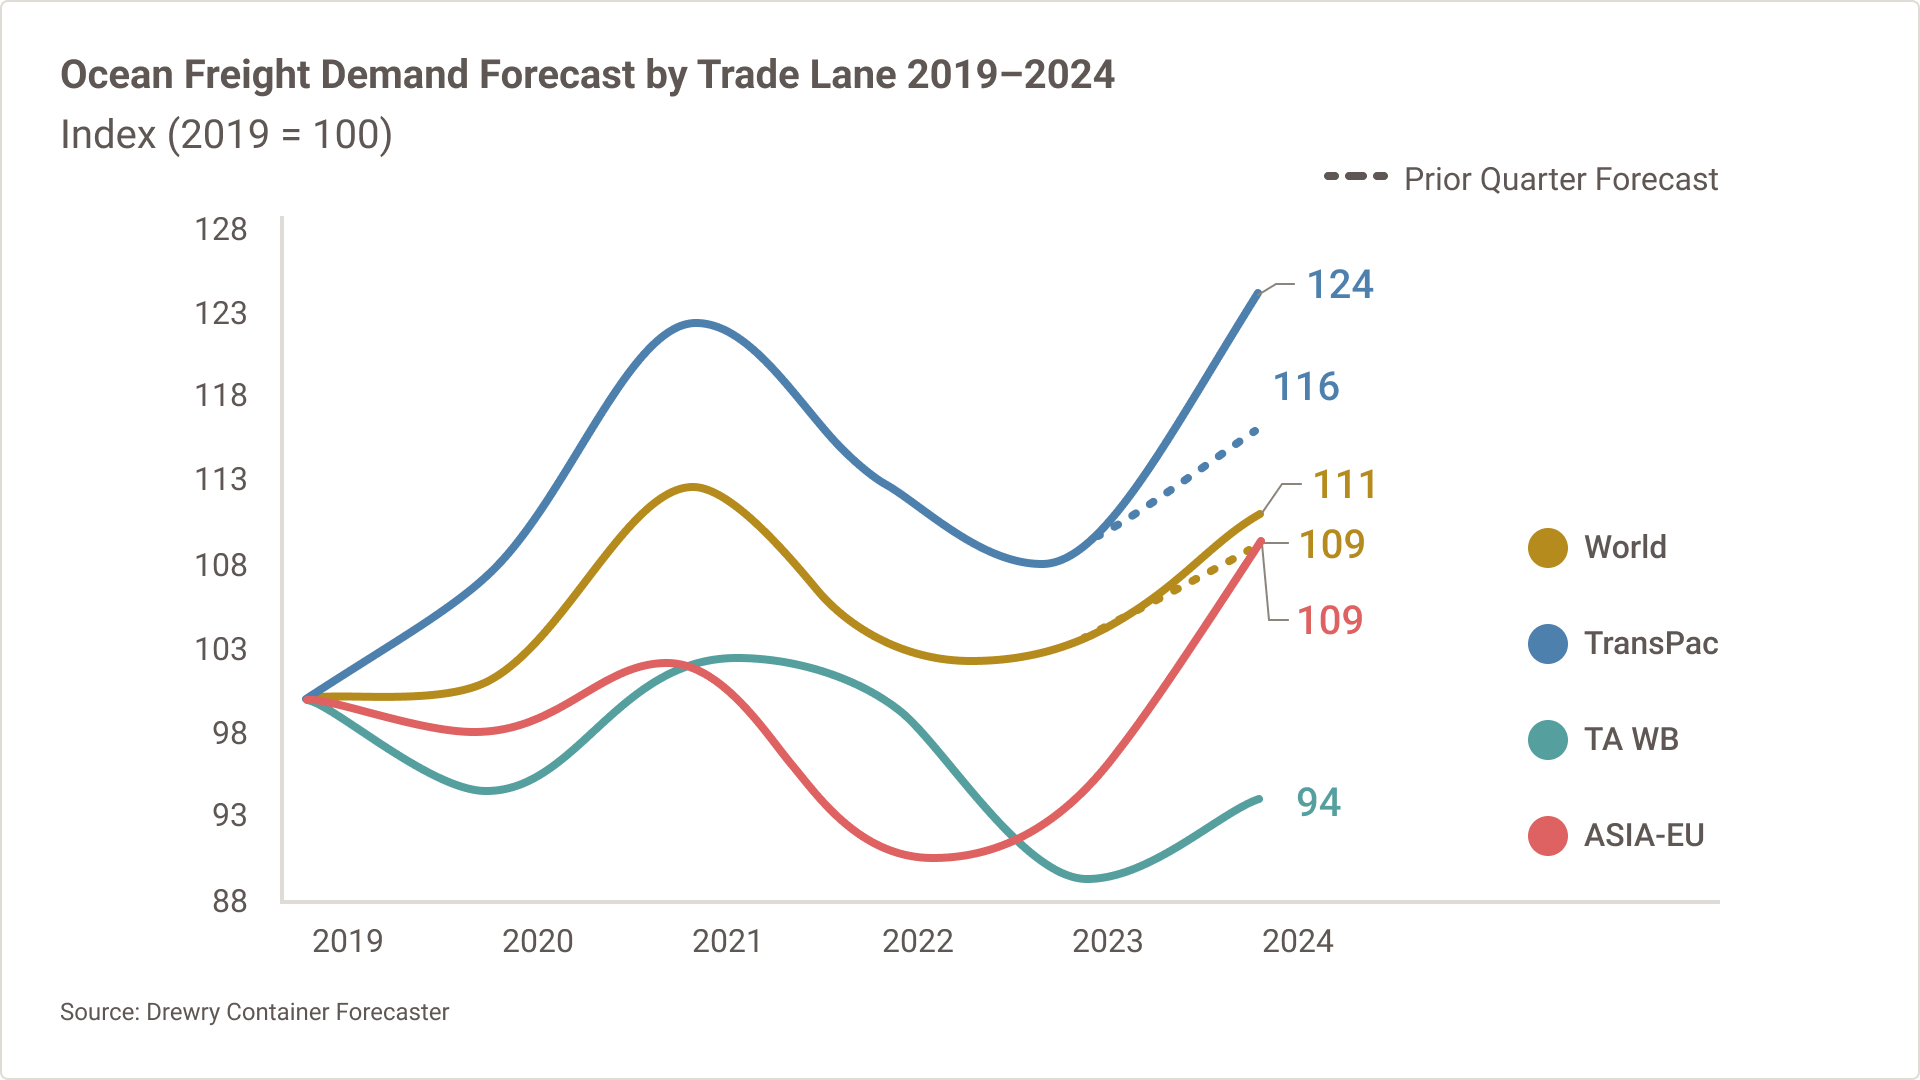
Demand
Situation:
- Volumes from Asia to US up +18% YoY growth through 1H241. Latest FY24 Forecast predicts 2024 will surpass the record-breaking volumes of 2021.1
- Rail dwell situation at US West Coast ports worsening; Number of containers dwelling 9+ days up +296% from 8/1 to 10/18.2
- Global Port Tracker has upgraded October US Import forecast to +3.1% YoY; November +0.9%; December +0.2%.3
Impact:
- West Coast congestion and rail delays are likely to continue as forecasts suggest a strong finish to 2024.
Sources: 1) Drewry, 2) Port of Los Angeles, 3) National Retail Federation
Capacity
Situation:
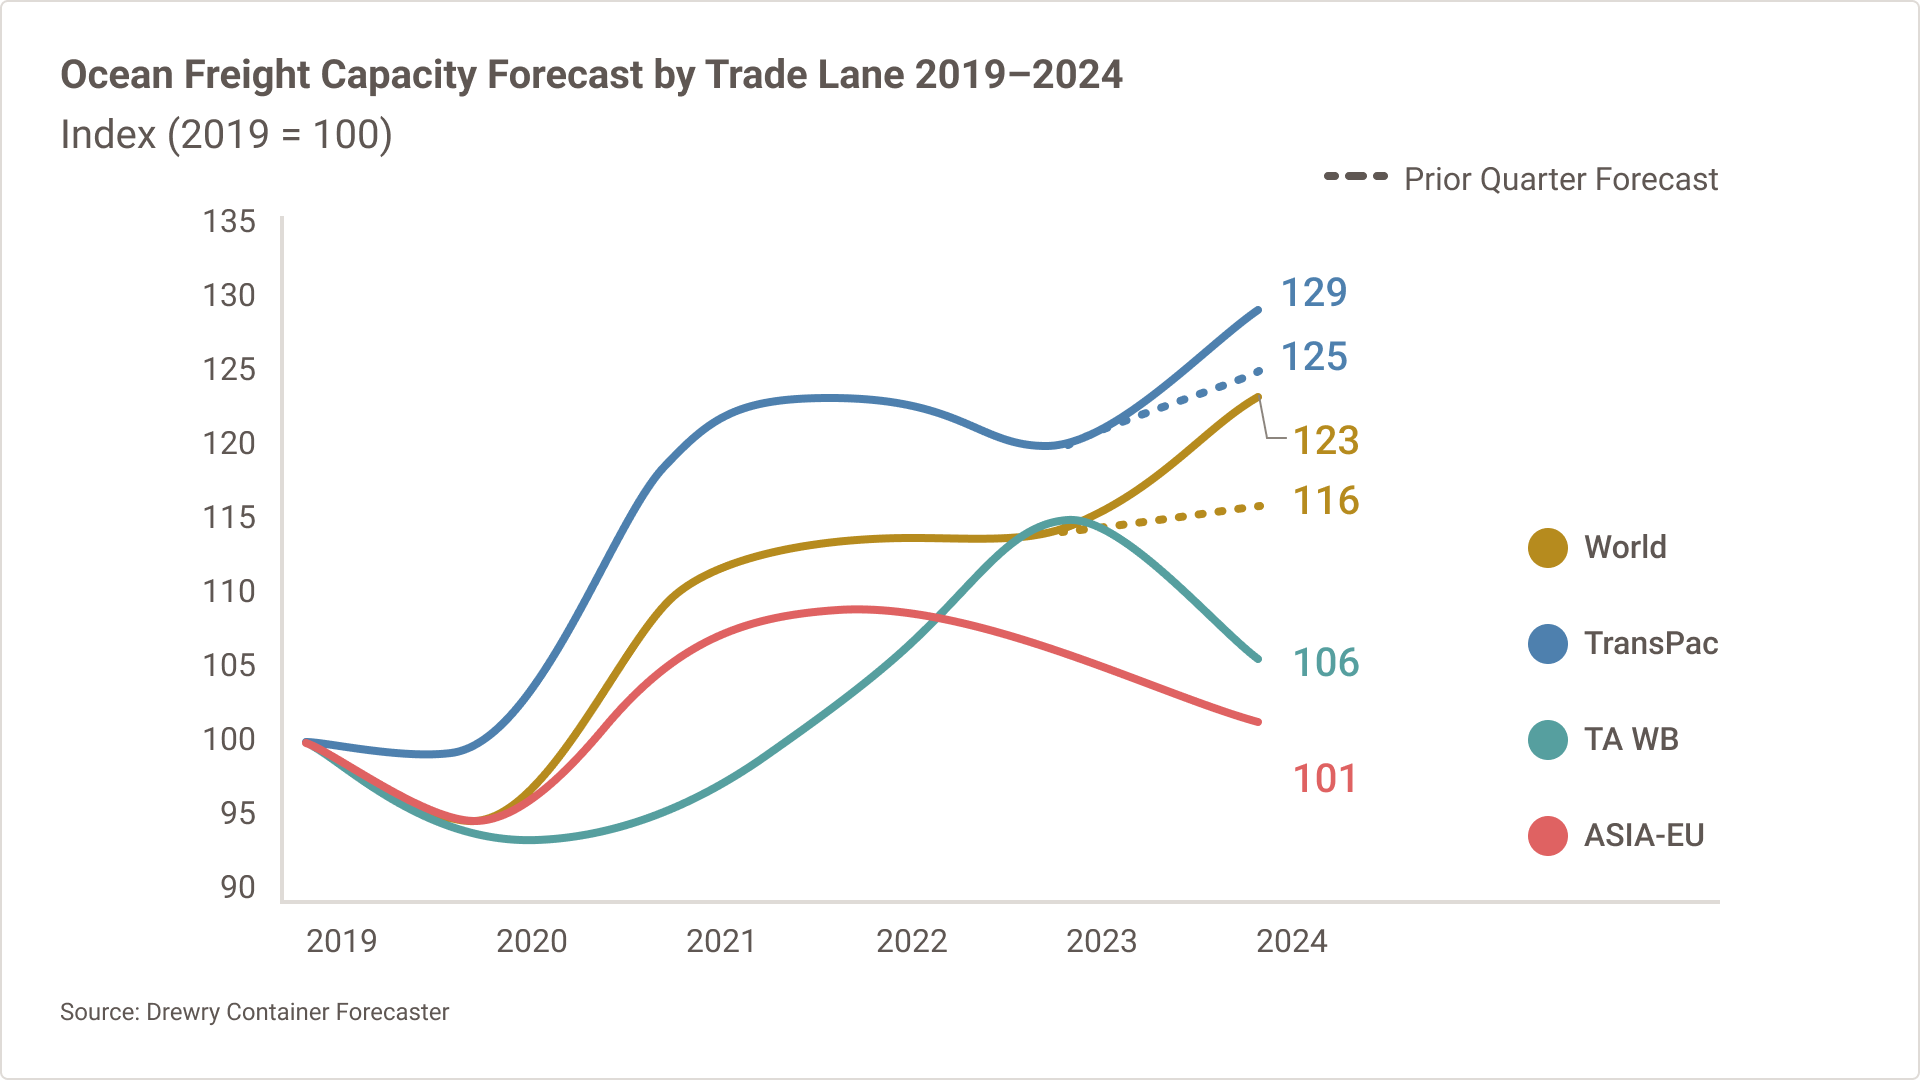
- Fleet growth expected at +11.2% YoY, with an additional +5.2% added in 2025.1
- Carriers have added or removed effective capacity in response to meet market demand trends.2
- From June to September, effective capacity increased +12.9% from Asia – NA, while declining -9.2% from Europe – NA.2
- Should demand not meet forecasts for 4Q, Blank Sailings will likely increase to avoid rate declines.
Impact:
- Despite continuing delivery of new vessels, capacity will remain constrained until carriers return to Suez Canal.
Sources: 1) Drewry Container Forecaster, 2) Alphaliner
Market Rates
Situation:
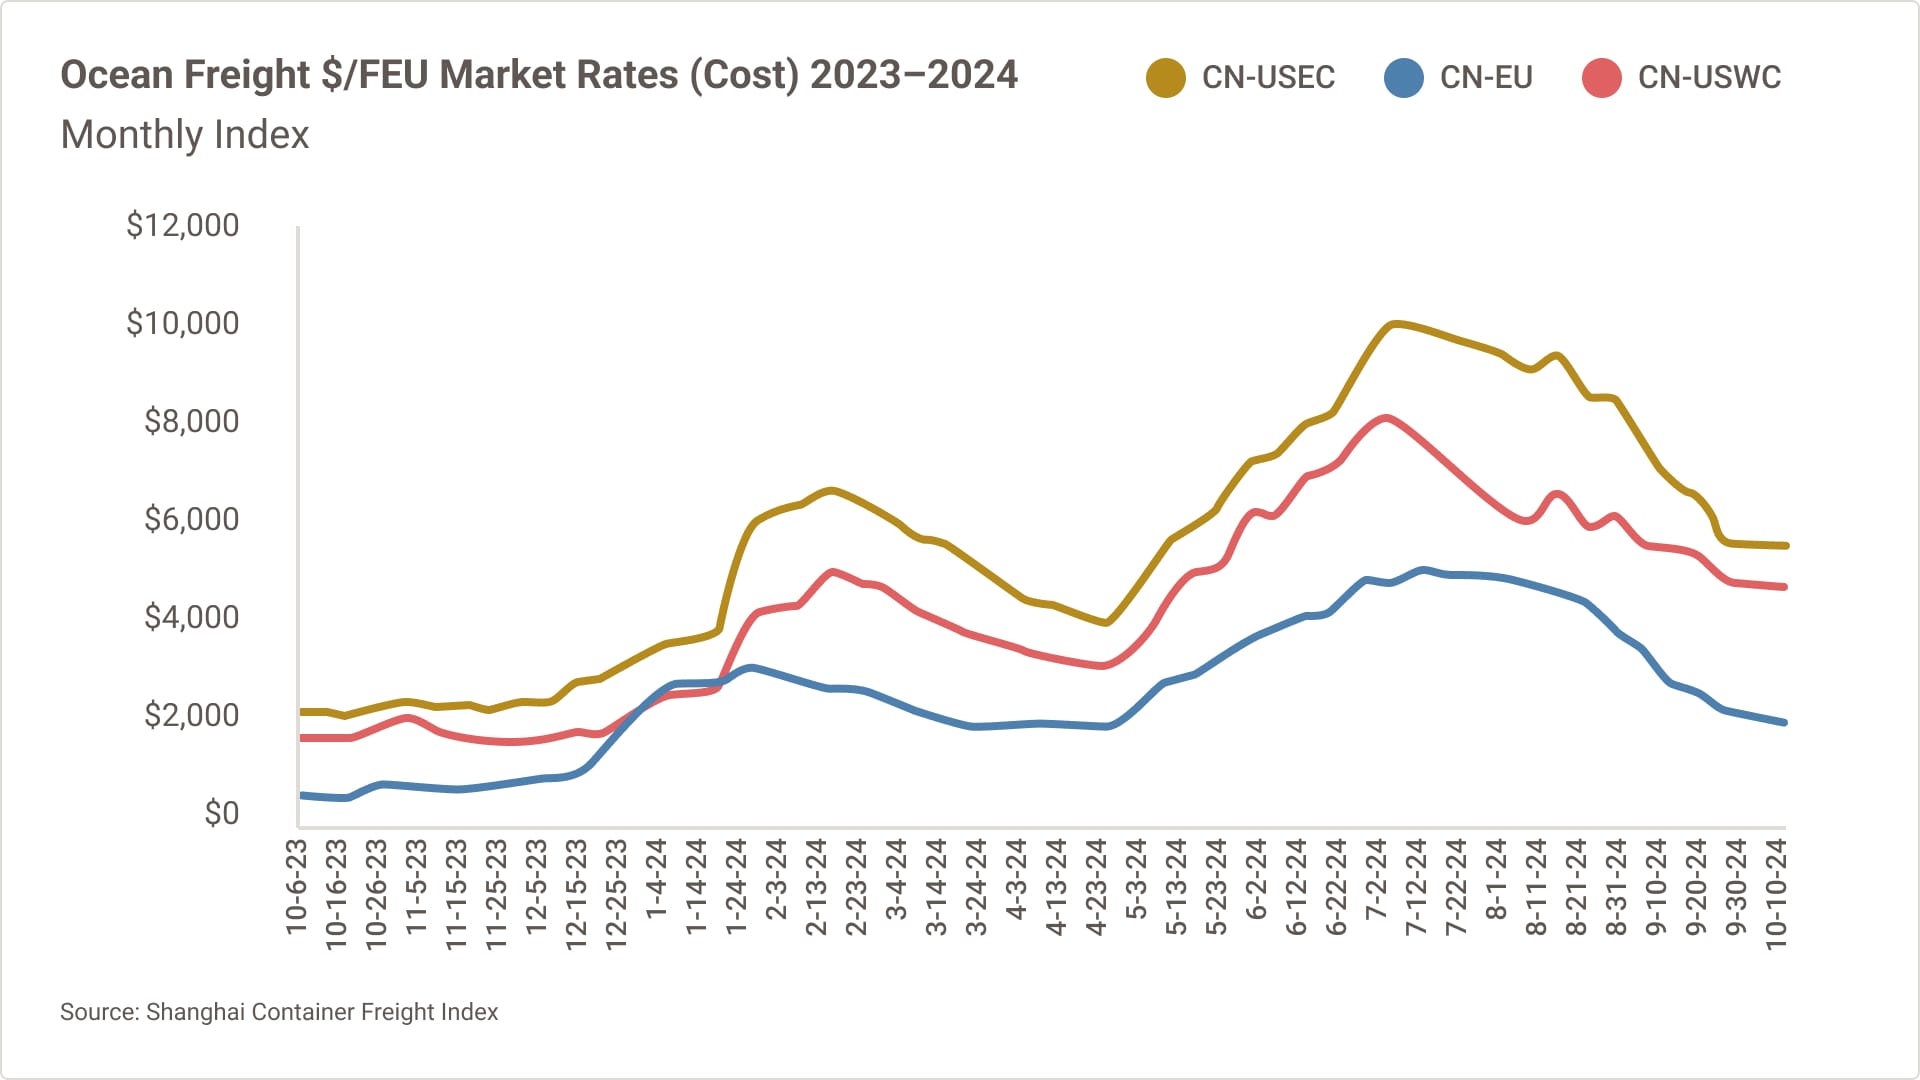
- Rates have cooled from Asia to the US as rapid increases in demand seen in the summer months has mostly subsided.1
- Rates from Asia to US East and West coasts are almost at parity, with the narrowest differential between the two trades in the history of the Platts index.2
- Some analysts believe we will see another off-season boom in demand from Asia to US if there is not a new contract between the ILA and USMX soon.3
Impact:
- Rates volatility in 4Q24 will depend primarily on the progress of labor negotiations and any potential advancement of cargo prior to January 15.
Sources: 1) Drewry, 2) Journal of Commerce, 3) Journal of Commerce
Industry Driver- Ongoing Negotiations between the ILA and USMX
- ILA Labor returned to work after a brief 3-day strike as the parties agreed to a tentative “handshake agreement” to extend the current contract by 90 days after coming to terms on one of the critical pieces of the negotiation – wages.1
- Several key roadblocks remain in the negotiations, particularly the union’s position of seeking “absolute, airtight language that there be no automation or semi-automation.”1
- USMX is expected to resist this demand to preserve growth opportunities for the US Market. Densifying through automation is a key means of facilitating TEU growth at container terminals.1
Implications: Strike action is likely to resurface if no deal is in place before January 152. Importers may consider advancing inventories to avoid disruption if negotiations do not meaningfully progress.
Industry Driver- Operational Impacts of US Import Demand
- The rapid and prolonged increase in US Import demand from May – September has mostly subsided, but the impacts to the US supply chain will still be felt for weeks to come.1
- Drewry has forecasted that Full-Year 2024 Asia to US volumes will surpass the record-breaking annual volumes from 2021.
- Intermodal delays in Los Angeles/Long Beach are now at two-year highs, with 49.9% of rail-bound containers dwelling for 9 or more days. The total number of monthly containers dwelling for 9 or more days has increased 296% in the last 11 weeks.2
Implications: China’s Golden Week holiday may provide relief for terminals to clear the backlog, but a second wave of off-season demand before the January 15 contract deadline would significantly strain US Ports.
Sources: 1) Drewry, 2) Port of Los Angeles
Industry Driver- Market Rates
- Rates from Asia to US have been in steady decline since August, as the massive import volumes throughout the early peak season have come back down to more normal levels.3
- Further rate declines may take place, but carriers are likely to utilize blank sailings to mitigate further declines. October saw the highest number of blanked sailings from Asia to US since February.4
Sources: 3) SCFI, 4) UPS Internal Analysis
Customs & Trade Compliance Trends
Recent Developments in Global Trade Policies Highlight Increased Measures to Address International Trade Imbalances and Geopolitical Conflicts.
Global Logistics & Distribution Trends
Decreasing inflation and interest rates driving consumer spending.
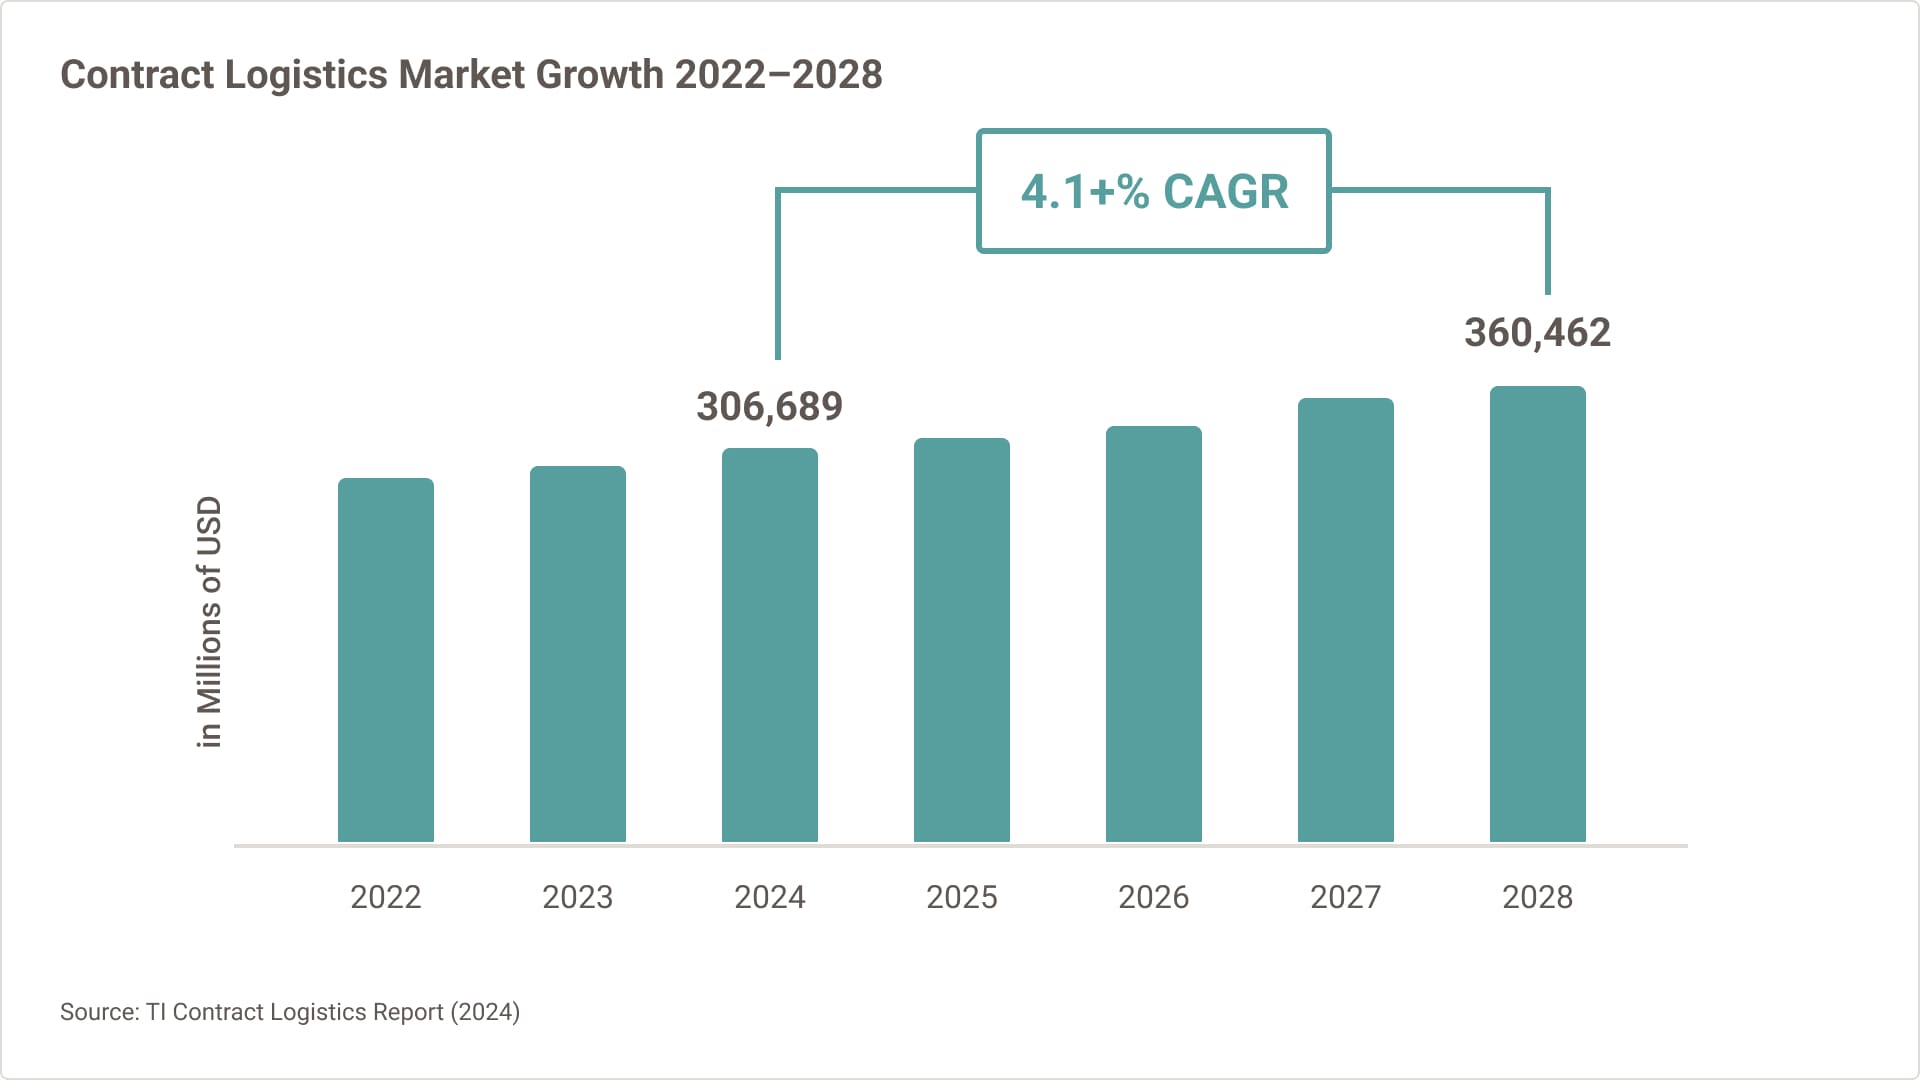
Global Contract Logistics remains on track for 4.2% YoY growth in 2024
- Global headline and core inflation fell in 2024 and is expected to fall further in 2025.2
- Central banks have been in rate cutting mode in 2024 and additional rate cuts are expected in the remainder of 2024.3
- Contract logistics market continues to outpace global GDP (2023-2024 YoY 2.7%, 2024-2028 CAGR 2.8%).1
Implications: Increased likelihood of rise in consumer spending and borrowing in 2024 and 2025 because of lower interest rates and decreased inflation.
Regionalized and Self-Sufficient Supply Chains
- Growth continues to be driven by emerging economies, with the APAC region experiencing significant expansion compared to more modest increases in North America and Europe.1
- Investment will continue in APAC, but a reconnection with domestic and regional supply chains is becoming more attractive, especially for countries that want to manage critical supplies.
Implications: While demand for logistics outsourcing is expected to increase, carriers will diversify their supply chain solutions to mitigate risk.
Source: 1) TI Contract Logistics Report (2024)
Industry Trends
- Companies are continuing to consolidate the market by acquiring others to strengthen their industry position.
- Warehousing costs are expected to keep rising and stay higher than historical averages, particularly in Western economies.
- Amid a tightening labor market, logistics carriers continue to invest in technology and automation to mitigate labor shortages.
Implications: Larger consolidated carriers may benefit from their scale competing in the marketplace.
More From UPS Supply Chain Solutions

UPS Freight Services
At UPS SCS, we’re here to simplify shipping freight. Find the freight service that’s right for you and get your freight moving in the UPS Forwarding Hub.
Explore Freight Services
Latest News
Read the latest freight and logistics news and market updates from the world of supply chain.
Read the Latest News
Ask an Expert
Questions? We’ll connect you to people with answers. Tell us about you, and choose a topic to get started.
Contact Us

